Part One in Our Year-End Dashboard Series
As we head into the last weeks of 2025, most diligence and investment teams are shifting gears: closing out active reviews, preparing board materials, and taking stock of what worked well and what needs to evolve heading into the new cycle.
If 2025 felt like running diligence with one hand tied behind your back, you are not alone. Across dozens of conversations this year with family offices, pensions, consultants, and wealth platforms, one clear pattern emerged. The teams that are thriving are not the ones with more data and documents. They are the ones with clarity. Clarity on where the opportunities are, what needs attention, where bottlenecks exist, and how decisions are being made.
The industry has moved beyond the era of manual data collection and into the era of AI-powered insight. 2026 will be less about having more information, and more about having the right visibility at the right time in a format that supports faster, smarter decisions.
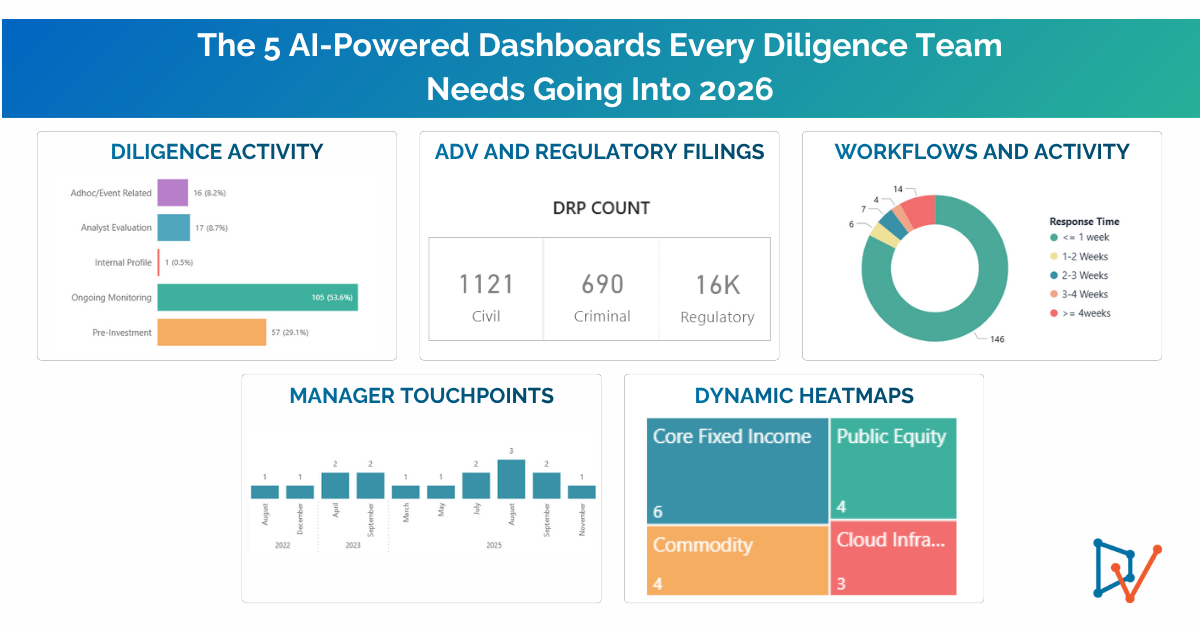
Dashboards powered by accurate data and AI are quickly becoming the operating system for modern diligence teams. Here are the five dashboards that are foundational going into 2026, and how AI transforms each one from static reporting into strategic advantage.
1. Diligence Activity Dashboard
Your real-time command center for active and historical reviews. One view that replaces scattered trackers and inbox chaos with true operational clarity.
What it enables:
- Visibility into all current and upcoming diligence (initial, ongoing, or event-driven). In 2025, our clients used DV’s ad hoc questionnaires to collect data around 6 events.
- Review cadence by strategy, region, risk tier, or team
- Manager response rates and coverage tracking
- Highlights response delays
- Automated next review date forecasting
No more spreadsheet tracking. No more missed follow-ups.
Example insight:
A global allocator discovered that 10% of our managers had not completed a full ODD review in more than 24 months because scheduling was tracked manually across teams, and we ran out of bandwidth. Once DV dashboards flagged overdue reviews, we cut planning time by 60% and launched short ongoing monitoring questionnaires. No fire drills. No blind spots.
2. ADV and Regulatory Filings Dashboard
Your early-warning system for emerging regulatory and business risks. The dashboard that sees problems before they become headlines.
What it enables:
- Side-by-side comparison of changes in AUM, fees, ownership, or service providers
- Alerts for issues such as new disciplinary disclosures or strategy shifts
- Monitoring of filing patterns across your entire manager set
- Helps protect fiduciary responsibility and strengthens oversight
Example insight:
“One allocator spotted a surprise 22% AUM decline and fee structure change that triggered a deeper review within 48 hours of filing and months before their next scheduled review.” Instead of reacting late, they acted early. They avoided a board surprise and saved weeks of compressed triage.
3. Workflows and Activity Dashboard
Your execution reality check. Where accountability, velocity, and alignment live. Replace tracker spreadsheets and long email / Slack / Teams threads.
What it enables:
- Tracks turnaround times for internal teams and external managers
- Makes bottlenecks visible so decisions are based on facts, not opinions
- Supports workload balancing and planning for peak cycles
Example insight:
A diligence step was consistently adding 3 to 4 extra weeks. The dashboard revealed that 80 percent of delays came from incomplete onboarding questionnaires, requiring follow ups. Updating question logic and making critical ones mandatory cut 12 days from the cycle.
4. Structured Diligence Data Dashboard
(Derived from Questionnaire responses, team input, and AI document extraction)
Your intelligence engine. Turning qualitative PDFs and long DDQs into quantitative insight.
What it enables:
- Side-by-side comparisons across managers, vintages, and sectors
- Trends on fees, LP terms, ESG, DEI, liquidity, valuation practices, service providers, cybersecurity and more
- Outlier detection at scale
- Time-series tracking of AUM, headcount, and performance metrics
How DV Assist transforms this dashboard:
DV Assist reads fund documents, DDQs, side letters, AFS, and quarterly reports, and automatically extracts and normalizes key terms into structured data. No more manual tagging or Excel stitching.
Compare fee structures across 80 private equity managers, or track how cybersecurity posture evolves across three years using structured responses and auto-scoring.
Example insight:
Using DV Assist, a finance team extracted valuation methodologies from 70 documents within hours. The dashboard revealed only 12 percent had independent valuation oversight and underperformance correlated directly with that gap. That finding reshaped their risk scoring model and triggered 8 targeted follow-ups.
5. Dynamic Heatmaps
Your decision clarity at a glance. Designed for boards, investment committees, and executive reviews.
What it enables:
- Real-time scoring across operational, investment, compliance, ESG, and cyber dimensions
- Supports escalation and remediation planning, not just passive evaluation
- Helps teams justify conviction decisions with confidence and transparency
Example insight:
Three managers were flagged for declining operational maturity based on delayed responses, outdated ADV elements, and documentation gaps. The heatmap drove a clear recommendation to redeem or engage. Two managers course-corrected immediately and remediation was tracked in DV.
Together, These Dashboards Create One Unified Advantage
Individually, each dashboard delivers meaningful value. Together, they form a single operating system for modern diligence: one that replaces scattered information and reactive work with clarity, speed, and confidence. Instead of reviewing information in isolation, teams gain real end-to-end visibility into every review, risk, dependency, and decision point. Insights arrive in real time, evidence becomes immediately actionable, and efficiency expands without adding headcount.
Diligence teams today are under intense pressure: do more with less, move faster without sacrificing accuracy, and support decisions with real-time intelligence rather than backward-looking reports. These dashboards are built for that reality and for a world where AI is no longer optional, but expected.
The Diligence Activity Dashboard provides complete transparency and control across all active reviews, so teams always know what is happening, what is stalled, and what requires action. The ADV & Regulatory Filings Dashboard acts as an early-warning system, surfacing operational and compliance risks across 20,000-plus advisers long before they become problems. The Workflow & Collaboration Insights Dashboard eliminates bottlenecks and turns coordination from reactive scrambling into structured accountability.
The Structured Diligence Data Dashboard + DV Assist and DDQ module converts unstructured responses and documents into comparable, decision-ready intelligence at scale, unlocking the real reward of investing in a digital platform. And the Dynamic Ratings Heatmap brings every insight together at the portfolio level, revealing trends, conviction, and confidence shifts that guide investment committees and fund boards toward stronger, faster decisions.
The teams that will win in 2026 are not the ones collecting the most data; they are the ones interpreting it best and acting first. These dashboards and AI integration enable that transformation. From information overload to true decision advantage.
Coming Next in This Series
Part Two: 3 Dashboard Mistakes Diligence Teams Should Avoid
Over-engineering, building dashboards in a vacuum, and treating them as static reports.
Want to See These Dashboards in Action?
Book a 15-minute walkthrough using your own data. Here is to entering 2026 with clarity, confidence, and AI-powered insight.