In the midst of the coronavirus, even with filing extensions allowed, this is the season when investment advisors who do business in the US must file Form ADV with the SEC. In February of this year, McKinsey published “A new decade for private markets”, its annual review of private investing, in which they noted asset growth of $4 trillion in the industry over the past decade. So, for this month’s blog we are focusing on private markets: what the ADV data tells us about this segment of the investment industry and how the information can be used by investors to enhance their success.
Number of Funds and Gross Assets
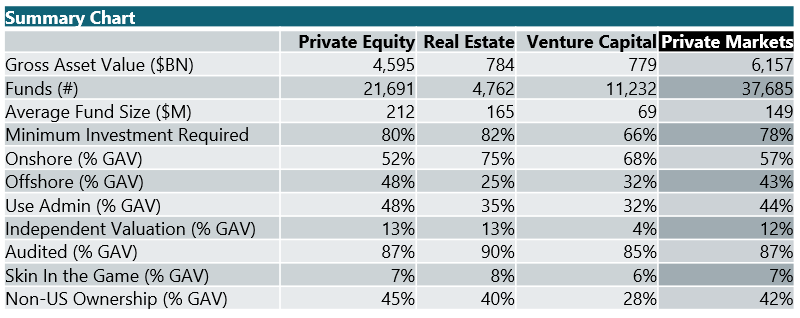
Our data sample counts >37,000 private funds managing >$6.1 trillion in gross assets (GAV), comprised of private equity, real estate, and venture capital; (the private equity category includes private credit). Within private markets, private equity funds are by far the largest segment with three quarters of the total gross assets and the largest average fund size at $212M. Real estate and venture capital command roughly the same gross assets, but predictably, the venture capital funds are much smaller in size (just $69M vs $165M for real estate) and almost three times the number.
Domiciles of Choice
Private market funds disclosed in Form ADV are domiciled in 48 US states and 46 jurisdictions abroad. The number of funds domiciled onshore is about 3 times the number offshore, while onshore funds contain 57% of gross assets.
However, the average onshore fund size is just $70M, about one third the size of offshore domiciled funds at $211M. Larger institutional investors seem to prefer offshore vehicles, explaining the disparity in size.
Delaware is the leading onshore domicile in every asset category, accounting for a whopping 94% of total onshore gross assets and 91% of onshore funds. It is followed by Florida for private equity, and California and Texas for real estate and venture, respectively.
Cayman Islands is the leading offshore domicile, dominating with 55% of assets and 52% of funds. The United Kingdom, Jersey, Luxembourg, Canada, and Bermuda are each within the top 10 for each segment.
Asset Administration
Most private market funds self-administer, as seen in the chart below. External administrators have penetrated less than half the private markets ecosystem.
The private equity segment is the greatest user of external administrators at roughly half of all funds. Real estate is the lowest at just 35% of both gross assets and number of funds, while venture capital uses external administrators for half of all funds but just one third of gross assets. (See Summary Chart toward the bottom for percentage calculations.)
Independent Valuation
There has been an increased focus on valuation of assets in private markets given the tremendous growth in the market, illiquidity, and lack of transparency. Looking at our data sample, just under 16% of total funds secure an independent valuation for all or a portion of their assets. In terms of gross assets, the percentage is even lower at just 12% subject to an independent valuation. Looking at the breakdown by fund type, private equity comprises 75% of the independently valued gross assets.
Audit
How many private market funds subject themselves to an annual audit? It turns out to be the vast majority by gross assets, or 87%, report they have completed an audit over the past year, with another 9% having undergone an audit but not reported the outcome. Only 3% were not audited, and 1% did not answer the question.
However, when looking at number of funds rather than gross assets, the portion undergoing audit was much lower: just 64%, so smaller firms are using external auditors less or are not reporting. The statistic is brought down by the venture capital segment, in which 52% of funds did not answer the question. This could be attributable to the fact that many VC funds are exempt reporting advisors. In this metric, it would seem that size enhances quality, although large size also needs checks and balances.
Alignment of Interest
Skin in the game is an important aspect of incentives alignment. For private market funds, roughly two thirds of funds are beneficially owned to some degree by the fund manager or other related parties. The amount of beneficial ownership by related parties totals $450BN or 7% of total private market gross assets. The percentage of gross assets held by related parties is quite consistent across all asset classes. Looking at number of funds, half of all private market funds have some skin in the game. That corresponds to well more than one third of private equity funds and two thirds of real estate end venture capital funds. Alignment of interests is popular!
Beneficial ownership by non-US parties is also very much in evidence, with 58% of all funds showing some degree of non-US ownership. Beneficial ownership of non-US parties totals close to $2.6TR or 42% of total gross assets. (See Summary Chart as well as charts below.)
Minimum Investment
Private market investments have traditionally been the domain high net worth and institutional investors. Just over one fifth of private market funds (also by gross assets) do not stipulate a minimum required investment. Over 40% of funds require an investment of greater than $500K, but that corresponds to only 12% of gross assets. Those funds requiring a minimum investment of $10M or more represent the largest share of gross assets at almost 40% and $2.4TR; but they account for just 12% of funds.
The private equity market is by far the largest segment at three quarters of gross assets. Forty-four percent of assets are gathered by funds with a minimum investment of $10M or more, while another 22% require a minimum investment of $1M or more. The smaller real estate segment also has a high entry ticket, as over 40% of assets are gathered by funds with a $10M minimum investment, with another 25% requiring a minimum investment of at least $1M. The venture capital segment has the lowest price of entry, with a required $10M investment accounting for just 5% of assets. Another 28% of assets require a $1M minimum investment.
The Summary Chart below provides a comprehensive overview of the data reviewed in this blog by market segment.
How to Use ADV Data
As we’ve seen, the ADV filings are rich in data – and the data points covered in this blog are a small subset of the information contained in Form ADV. There is much more information around service providers, control persons, and DRPs (Disclosure Reporting Pages) regarding civil, criminal and regulatory issues, etc. But the data is relevant not just for the individual managers and funds. When looked at in aggregate, the data provide us with industry benchmarks and inform us as to how the managers we follow compare to their peers. When you are processing the details of each individual filer with manual efforts, it seems an impossibly daunting task to comprehend all the information within a broader industry context.
In order to get a comprehensive view of your managers relative to the 21,000+ managers who file and the 37,000+ funds that are disclosed, you need technology that can process the entirety of the data set to inform the relative positioning and choices of your managers. When considered in aggregate, it’s clear that the ADV data of individual managers provides you with just the starting point for your analysis of their business. Wouldn’t it be helpful to have technology that gives you summary views and graphics of basic metrics at a glance? While also allowing you to drill down on specific changes as they are disclosed to understand key developments at your managers within a broader industry context?
While private markets remain opaque, the public data illuminate key trends and benchmarks for best practices and business strategy deployed by GPs. When you have access to this kind of data and technology at scale, your view is much better informed across the peer group as a whole than when you are bogged down in the minutiae of large individual filings. Traditionally ADV data has been used by investors for ODD and compliance monitoring. But given the rich dataset, it is a great resource for finding new opportunities, understanding GP mindset and choices, and identifying strategic drivers of success. ADV information is useful not just for investors, but also for fund managers looking to benchmark their peer group and service providers sourcing new business. The team at DiligenceVault is happy to show you how! Click on this link for a demo and join the conversation: DiligenceVaultDemo